Jerry Gulke: Is the Top in For Wheat?
In September, I discussed whether or not fundamentals really matter. I examined spring wheat prices and showed how the price had rallied due to supply-and-demand fundamentals commensurate with 2011 and 2013.
Not then nor this summer was total wheat supply and demand near those of 2008, when prices hit $25 per bushel. Often tops in bull markets end with a technical pattern that might reflect a warning ahead of a subsequent retracement of past price appreciation.
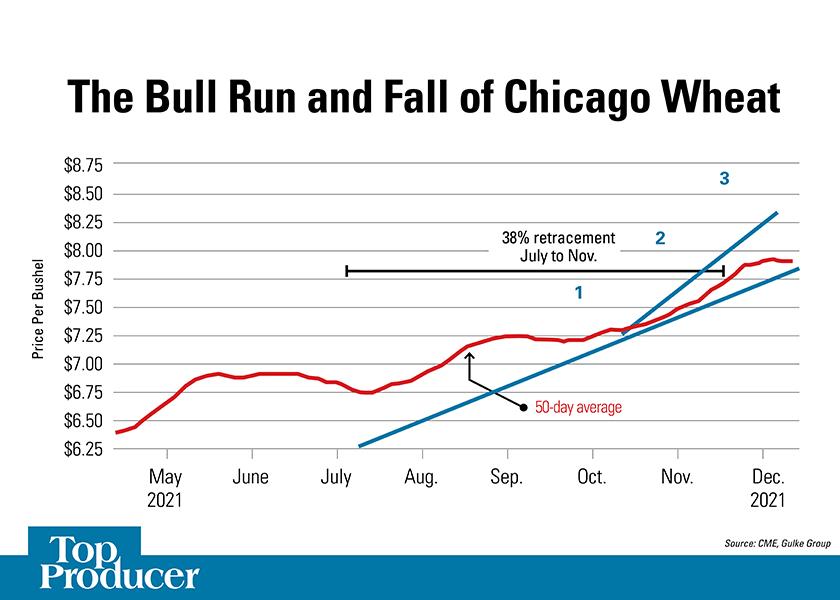
Chicago wheat started its bull run from the July harvest low with a retraction before beginning its urgent upward climb in an attempt to ration supply. While wheat lost $1 per bushel during the short pre- and post-Thanksgiving period, the 38% retracement at $7.80 needs to be put in perspective.
Previously, September 2020 Chicago wheat spent six years below $6.
NASS will publish its 2021 crop results on Jan. 12, 2022, including the drought-stricken spring wheat crop. In early December, Canada saw its premium wheat crop stocks were higher than expected. The subsequent drop in CME futures could be telling us what might happen in January for the U.S. crop.
A SHOT OVER THE BOW
At best, the CME wheat futures gave a shot over the bow, showing just how quickly market sentiment can change. Technical action forewarned us days before what was fundamentally realized, which included Egypt’s largest purchase in history — at prices below market from our competitors in what was supposed to be a tight-stocks environment.
The U.S. marketing year is half over and while our new crop is yet to be quantified, I know we are a small fish in a big global wheat pond. Thus, when prices action conflicts with fundamentals, I’ll respect technical signals.
Key Events in Wheat
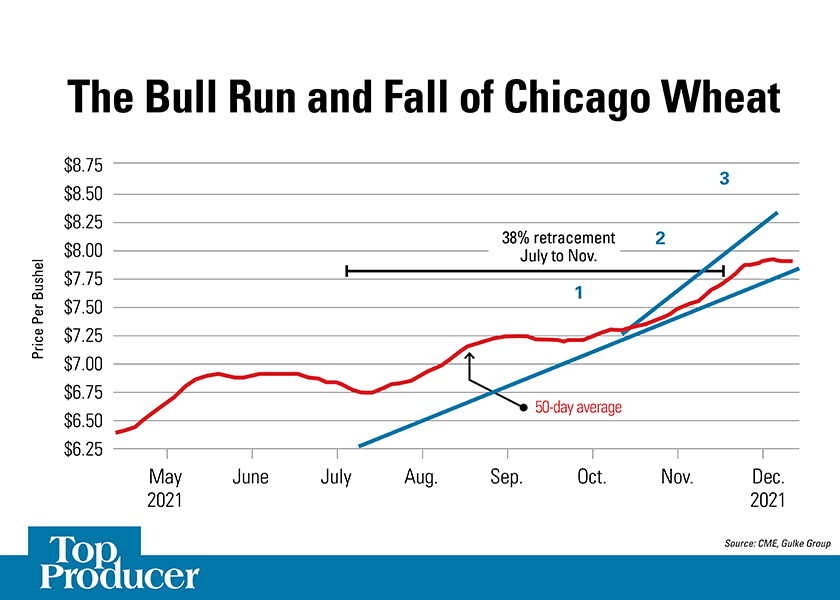
- Three waves higher (noted as 1, 2 and 3).
- A reversal off of new highs.
- A subsequent trading gap lower.
- A major reversal in a failed attempt to recover, quickly breaking a steep uptrend.
- A pause in another attempt to recover, subsequently breaking a longer and less-steep uptrend.
- Prices falling below a 50-day uptrend (red line).
- A 38% retracement serves as a pause to reassess previous technical action.
- The failure to recover and a failed attempt to rise back above an uptrending focus can lead to a 50% or even 90% retracement.
- Timing is important; the U.S. crop is yet to be quantified.
Jerry Gulke farms in Illinois and has interests in North Dakota. He is president of Gulke Group, a market advisory firm. Disclaimer: There is substantial risk of loss in trading futures or options, and each investor and trader must consider whether this is a suitable investment. There is no guarantee the advice we give will result in profitable trades. Past performance is not indicative of future results.
With Nashville as the backdrop, Top Producer Summit brings together the nation’s top producers for networking, education, entertainment and more. Take time away from the farm to discover business opportunities, gain invaluable insights and increase your competitive advantage.
Register now!