Cattle Consolidate

Live Cattle
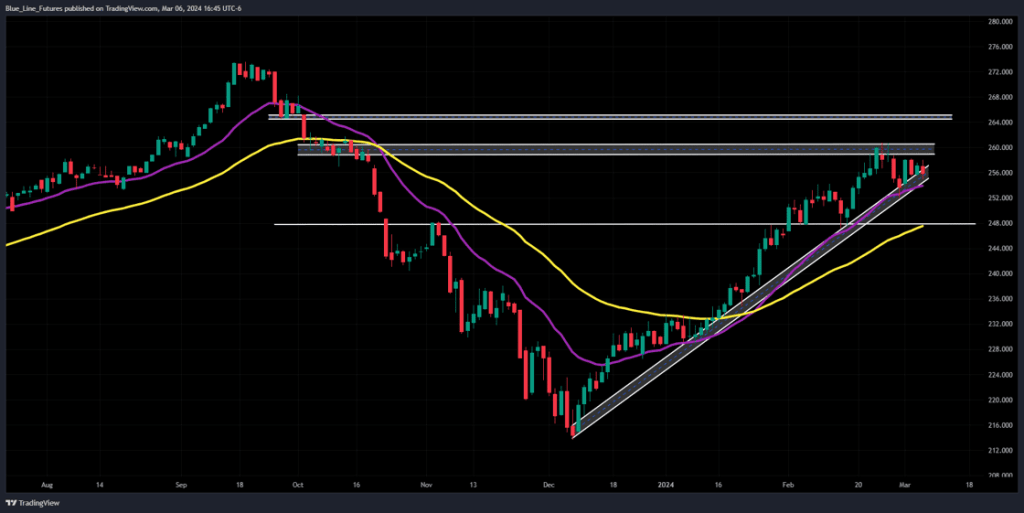
Technicals (April- J)
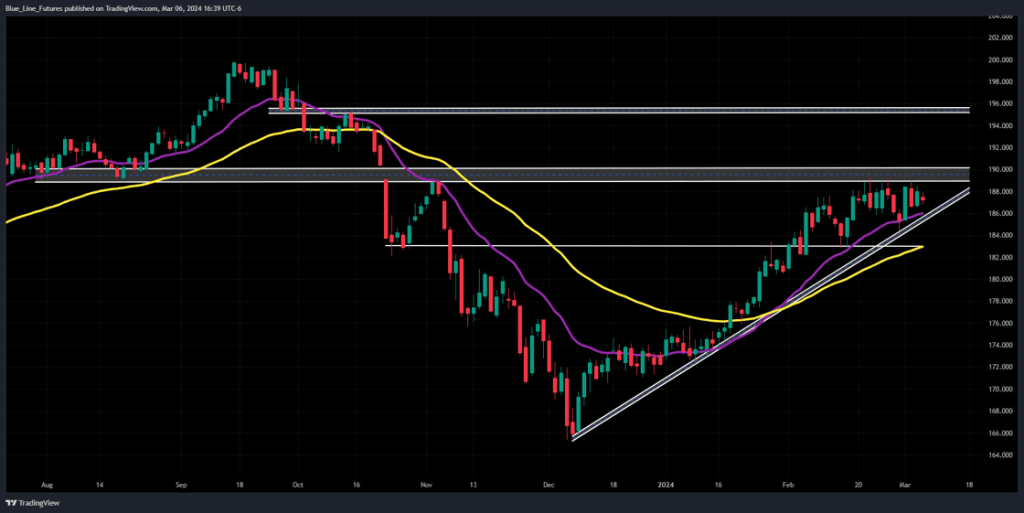
April live cattle had "an inside day", meaning that prices traded within the previous day's range. As you can see from the chart below, it appears as the market is building up energy and approaching an inflection point as trendline support and overhead resistance continue to converge. The Bulls want to see a close out above resistance from 189.10-190.275. If they can achieve that we could see a swift move higher taking us back into the mid 190s. On the flipside, support comes in from 186.00-186.50. This pocket represents trendline support and the 20-day moving average (purple line in chart below). A break and close below that pocket could trigger a wave of selling down to the 50-day moving average (yellow line in chart) near 183.00, which has previously been a tug of war area between buyers and sellers over the last six-months.
Yesterday's boxed beef was little changed. Choice cuts were .12 higher to 304.91 and select cuts were .22 higher to 295.09. The 5-area average price for live steers was at 181.22, but only on 323 head. Daily slaughter was reported at 124k head, 1k less than the previous week and about 1k less than the same day last year.
Resistance: 189.10-190.275***
Pivot: 187.30-188.05
Support: 186.00-186.50*, 182.60-183.45
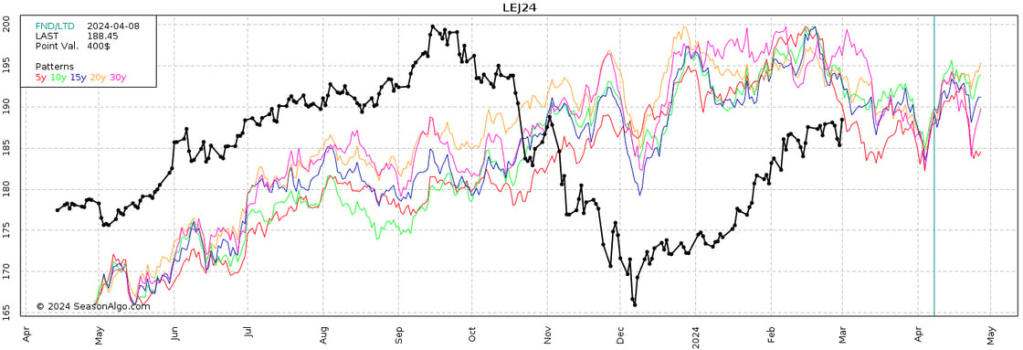
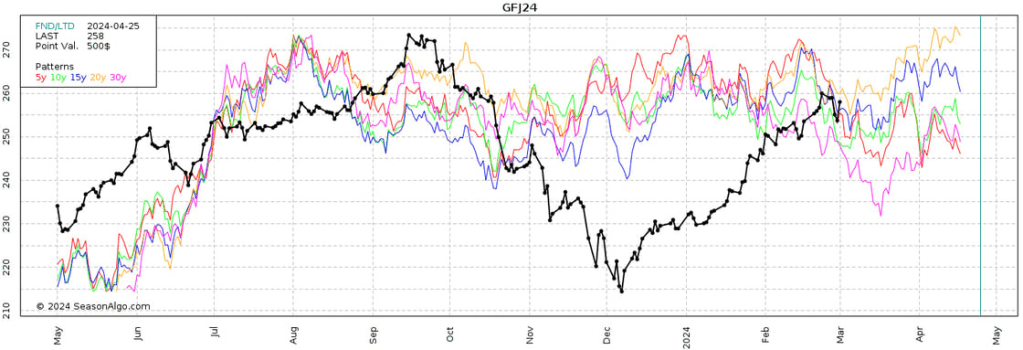
Seasonal Tendencies
Below is a look at historical seasonality's (updated each Monday) VS today's prices (black line). Seasonally we start to see April futures top out, but if you've been watching cattle at all over the last year you know that seasonals tendencies tend to have had a lower correlation this year.
*Past performance is not necessarily indicative of futures results.
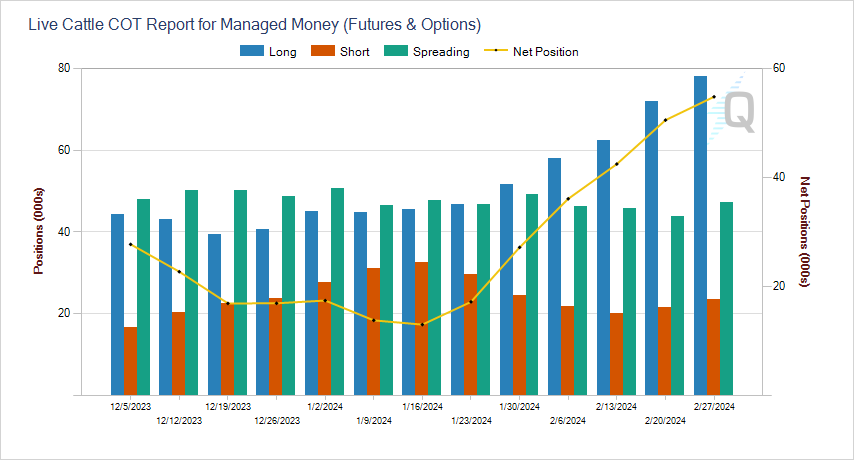
Commitment of Traders Snapshot
(updated on Mondays)
Friday's Commitment of Traders report showed Funds were net buyers of about 8k futures and options contracts, extending their net long position for the sixth consecutive week, now sitting roughly 55k contracts long. Typically, we would view this as a relatively Neutral/Bullish position. This is about half of the length they had when prices peaked last Fall.
Feeder Cattle
Technicals (April- J)
April feeder cattle futures continue to consolidate as support and resistance continue to converge, potentially leading to an inflection point for the market to breakout or break down from. Our bias is more on the cautious side here as we believe live cattle could outperform feeders from these levels. One of our bigger near-term concerns with feeders is the potential for a relief rally in corn. Support the Bulls want to defend comes in from 253.85-254.25, a failure to hold ground there could lead to a retest of the 50-day moving average (yellow line in chart below) near 248, which also happens to consider with some previously important price points, depicted by the lowest white horizontal line in the chart below. Seasonals, although far from perfect, also play a role in this bias.
Resistance: 260.65-260.80***
Pivot: 255.60
Support: 253.85-254.25, 251.97-252.60*, 247.15-248.50
Seasonal Tendencies
Below is a look at historical seasonality's (updated each Monday) VS today's prices (black line). Historically, this isn't the best time to get supper bulled up on Feeder Cattle, but time will tell.
*Past performance is not necessarily indicative of futures results.
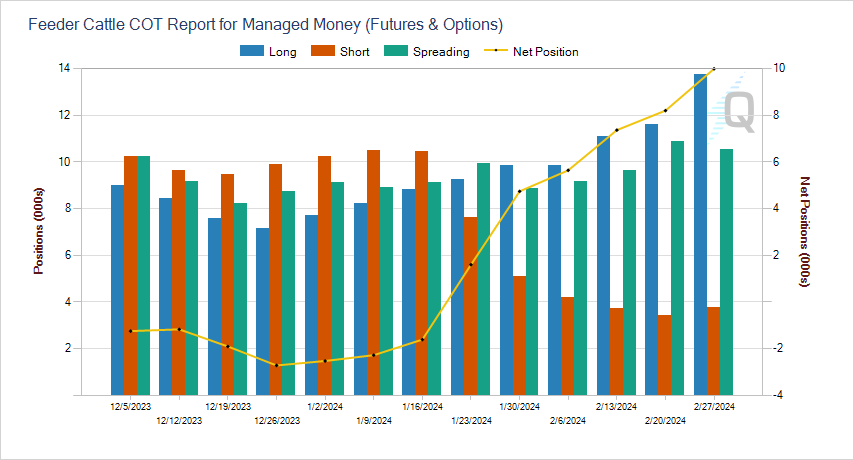
Commitment of Traders Snapshot
(updated on Mondays)
Funds expanded their net long position in feeder cattle to 9,991 futures and options contracts. This was the ninth straight week of Funds adding to net longs which puts them at their largest net long position since the end of September.
Lean Hogs
Technicals (April- J)
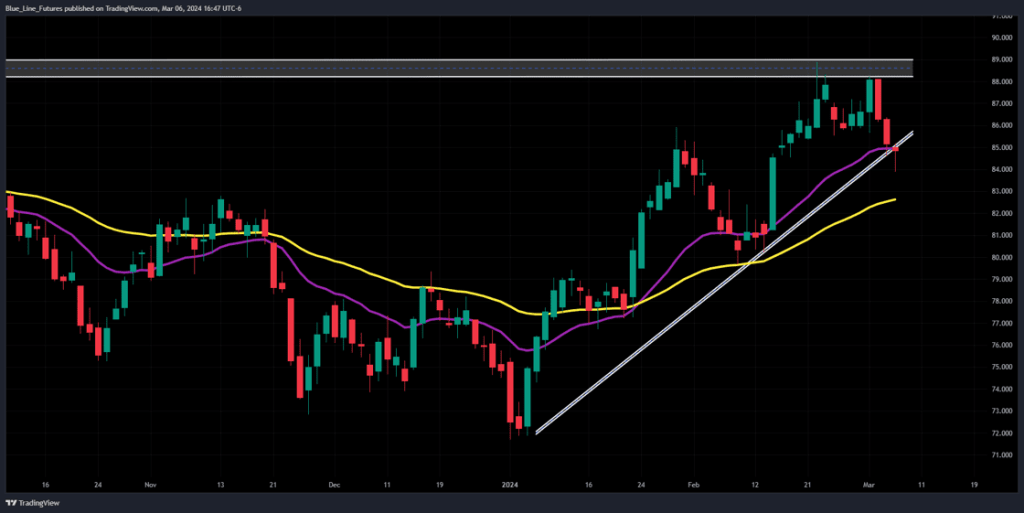
April lean hogs broke below trendline support and the 20-day moving average (purple line in chart below) but were able to defend our support pocket from 83.60-84.40 and rally back near trendline support and the 20-day moving average at the close. A failure to reclaim ground above here with conviction could keep the sellers active with the next downside target coming in from 82.40-82.80, which represents the 50-day moving average and the February 14th breakout point.
Resistance: 89.00-89.05**
Pivot: 85.50-86.05
Support: 83.60-84.40, 82.40-82.80
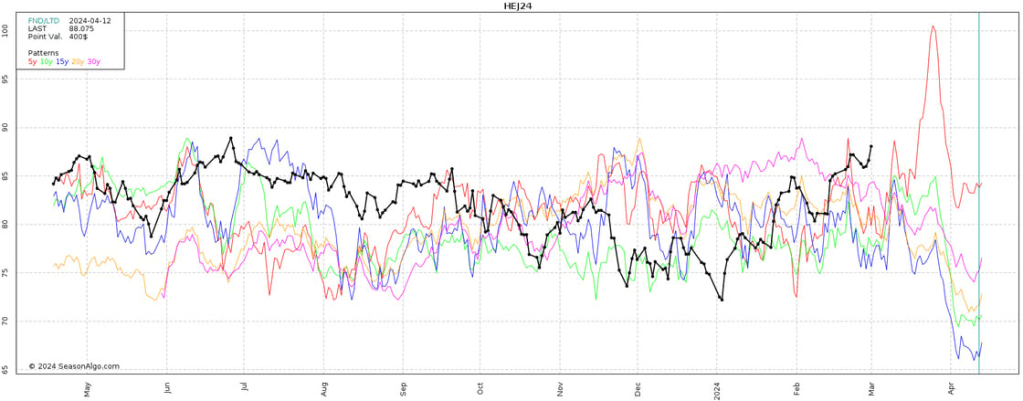
Seasonal Tendencies
Below is a look at historical seasonality's (updated each Monday) VS today's prices (black line).
*Past performance is not necessarily indicative of futures results.
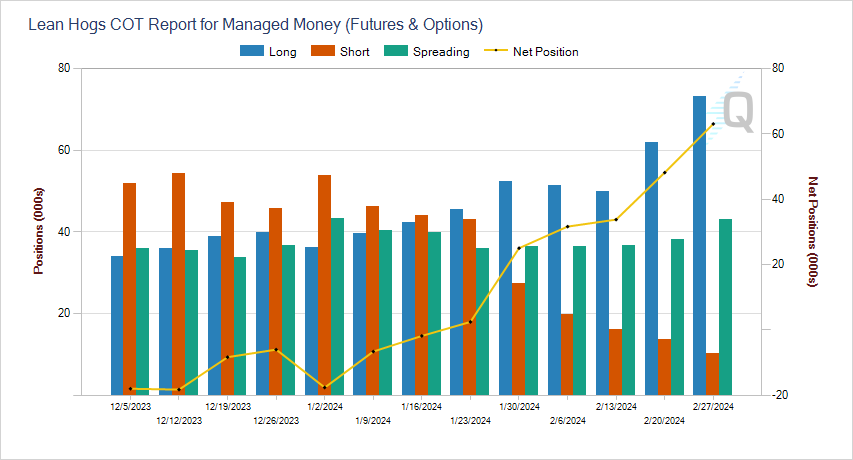
Commitment of Traders Snapshot
(updated on Mondays)
Friday's Commitment of Traders report showed funds expanded their net long position to 63,064 futures and options contracts, up roughly 15k from the previous week. This was the eight straight week that Funds were net buyers.
Futures trading involves substantial risk of loss and may not be suitable for all investors. Therefore, carefully consider whether such trading is suitable for you in light of your financial condition. Trading advice is based on information taken from trade and statistical services and other sources Blue Line Futures, LLC believes are reliable. We do not guarantee that such information is accurate or complete and it should not be relied upon as such. Trading advice reflects our good faith judgment at a specific time and is subject to change without notice. There is no guarantee that the advice we give will result in profitable trades. All trading decisions will be made by the account holder. Past performance is not necessarily indicative of future results.
Blue Line Futures is a member of NFA and is subject to NFA’s regulatory oversight and examinations. However, you should be aware that the NFA does not have regulatory oversight authority over underlying or spot virtual currency products or transactions or virtual currency exchanges, custodians or markets. Therefore, carefully consider whether such trading is suitable for you considering your financial condition.
With Cyber-attacks on the rise, attacking firms in the healthcare, financial, energy and other state and global sectors, Blue Line Futures wants you to be safe! Blue Line Futures will never contact you via a third party application. Blue Line Futures employees use only firm authorized email addresses and phone numbers. If you are contacted by any person and want to confirm identity please reach out to us at info@bluelinefutures.com or call us at 312- 278-0500
Performance Disclaimer
Hypothetical performance results have many inherent limitations, some of which are described below. No representation is being made that any account will or is likely to achieve profits or losses similar to those shown. In fact, there are frequently sharp differences between hypothetical performance results and the actual results subsequently achieved by any particular trading program.
One of the limitations of hypothetical performance results is that they are generally prepared with the benefit of hindsight. In addition, hypothetical trading does not involve financial risk, and no hypothetical trading record can completely account for the impact of financial risk in actual trading. For example, the ability to withstand losses or to adhere to a particular trading program in spite of trading losses are material points which can also adversely affect actual trading results. There are numerous other factors related to the markets in general or to the implementation of any specific trading program which cannot be fully accounted for in the preparation of hypothetical performance results and all of which can adversely affect actual trading results.