Controlled Implosion
Market Watch and Nov Soybean Tech Talk
with Alan Brugler and Austin Schroeder
July 1, 2022
Implosion
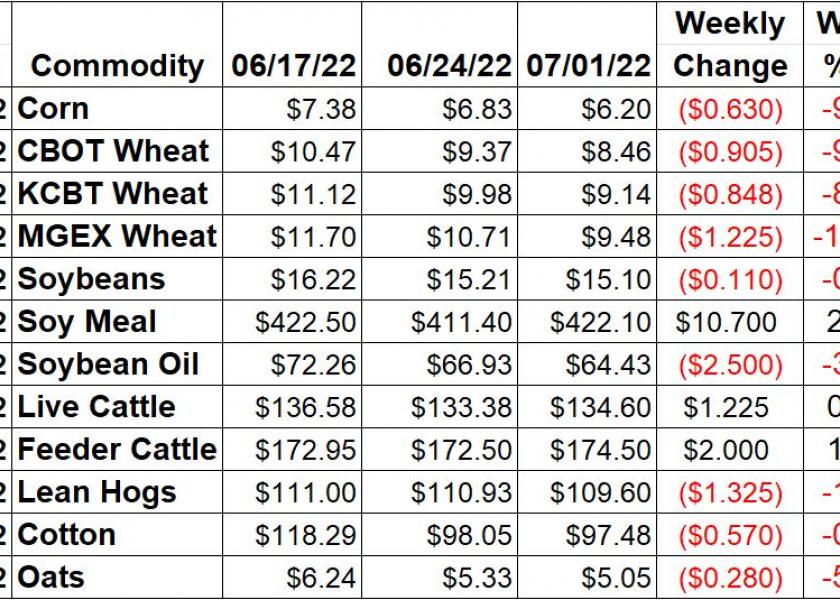
Last week we were bemoaning the fact that all of the commodities in our tracking table had settled lower, leaving a sea of red numbers. References were made to a red light and a screeching halt. Believe it or not, this week was not as bad, with three of the commodities showing plus signs. Soybeans had a very ugly Friday, with November down 62 ¾ on the day, but the net loss for the week was mitigated by the Monday-Wednesday short covering rally. The best description we could come up with for this week was a controlled implosion. That’s where they take an old building in an urban area and rig the demolition charges so that it falls in place, limiting damage to the surrounding area but wiping out the items within the blast area. We don’t know who owned the corn and wheat building, or who set the charges, but the urban renewal theme works pretty well with commodities. They gyrate between scarcity and surplus, with panic, fear and greed driving the process.
Corn futures collapsed this week amid long liquidation and an extended forecast calling for rains in portions of the Corn Belt during the first half of July. Nearby July was down 9.3%. The big June 30 reports were not a surprise. NASS indicated 89.92 million acres of corn planted this spring, up 430,000 acres from the March Intentions report and on par with estimates. June 1 corn stocks were tallied at 4.346 bbu, a 235 mbu increase over last year. Monday’s Crop Progress report showed condition ratings for corn down another 3% to 67% gd/ex or 7 points lower on the Brugler500 Index at 369. Thursday’s Export Sales report tallied old crop corn sales at a new MY low of 88,800 MT. US old crop corn export commitments (shipped plus outstanding sales) are now at 60.424 MMT, 13% below last year at this time. Friday ‘s Commitment of Traders report indicated spec funds pared 36,649 contracts from their net long position in the week ending June 28. That took their net long down to 228,615 contracts by Tuesday but they probably wished it was even smaller by Friday!
Wheat futures led the grain complex lower this week. Minneapolis HRS was the weakest, down 11.4%. Chicago was down 9.7% and KC HRW dropped 8.5%. Thursday’s Grain Stocks report showed 660 mbu of wheat in on and off farm storage as of June 1. That is also the 2021/22 ending stocks total and down 186 mbu from a year ago. The Planted Acreage report from NASS showed 47.09 million acres of all wheat planted for the 22/23 crop year, down 340,000 acres from March. Much of that came from winter wheat, with spring wheat acres dropping 90,000 acres to 11.11 million. Crop Progress data from Monday showed 8% of the spring wheat headed vs. the 5 year average of 34%. Ratings were unch at 59% gd/ex, with Brugler500 index down 5 at 354. Winter wheat harvest had reached 41%, vs. 35% on average. The Brugler500 index (includes all 5 condition categories) for winter wheat was down 1 point @ 268. Export Sales data saw an increase on last week to 496,700 MT of wheat sold for export in the week of 6/23. CFTC showed the managed money spec funds removing another 2,915 contracts from their CBT net long in the week ending 6/28, taking it to 1,020 contracts. Spec longs in KC trimmed 7,738 contracts from their position that week, bringing it down to 24,856 contracts as of Tuesday night.
Soybeans were also in the bear parade but didn’t join until after the USDA reports on Thursday. Gains the first part of the week buffered the steep Friday sell off, leaving net change for the week at -0.7%. Product values were mixed, with meal up 2.6%, while soy oil dropped another 3.7%. Malaysian palm oil again was a culprit. The NASS crop ratings showed further deterioration. That dropped the Brugler500 rating to 369. USDA’s Thursday Soybean Stocks number was a little larger than the average guess, at 971.44 million bushels. On the other hand, NASS counted only 88.325 million planted acres for soybeans, more than 2 million below the average trade guess. The weekly CFTC report showed the managed money spec funds reducing their net long by 29,915 contracts in the week ending June 28, putting them net long 124,498 on that date.
Live cattle futures were up 0.9% this week. June futures went off the board at $138. August rallied on Friday to close part of the expiration gap on the charts (and weaken the basis). Cash trade was mixed this week, with the south mostly $137 and the north $146-150 with the bulk at $148. Feeder cattle were up $2.00 or 1.2%, thanks mostly due the sharp drop in feed costs. The CME Feeder Cattle Index was $165.67, up $1.96 from the week prior. Wholesale beef prices were lower this week. Choice boxes were down $1.16 (-0.4%) per 100 pounds, with Select $4.55/cwt lower (-1.9%) from Friday to Friday. Weekly beef production was down 4.6% from the previous week, but 0.5% larger than the same week in 2021. Beef production YTD is up 0.9% on 1% larger slaughter. The weekly Export Sales report showed 17k MT of beef was sold during the week that ended 6/23. That was up 52% wk/wk and 40.6% yr/yr, but was still the second lowest since April. The Commitment of Traders report on Friday showed spec funds cutting 14,877 contracts from their net long position in the week ending June 28, dropping it to 24,265 contracts net long.
Lean hog futures were down 1.2% for the week. The CME Lean Hog index was $110.84, up 15 cents from last week. The pork carcass cutout value was down $3.45 (-3.1%) this week. Bellies were the weakest primal. US weekly pork production was down 1.0% from the previous week but up 4.1% vs. the same week in 2021. YTD production is down 3.5%. The Hogs and Pigs report on Wednesday confirmed continued downsizing of the US hog herd, with fewer sows and market hogs than a year ago. China’s herd is also shrinking, with sow numbers down 8% year over year in May according to revised ag ministry data. FAS reported 32,296 MT of pork was booked for export during the week that ended 6/23. That was a 5 week high and was up 13% yr/yr. The Commitment of Traders report indicated a rise in the spec fund net long of 1,825 in the week of 6/28, putting it at 30.639 contracts.
Cotton futures slowed their descent. After December was down a whopping 17.11% the previous week, it was down only 0.6% this week. July open interest has evaporated to just a few handfuls of contacts. NASS reported 33% of the cotton crop was squaring as of 6/26. That was up 11% points wk/wk and matches the average pace. National conditions were down 12 points on the Brugler500 Index through the week to the lowest reading of the season – 298. On Thursday, NASS reported US cotton acreage for 2022 would be 12.478 million acres based on the early June survey. The Commitment of Traders report showed managed money spec funds were net long 46,738 cotton futures and options contracts as of June 28, down a sharp 14,372 from the previous week.
Market Watch
The next week gets off to a delayed start with the trade taking Monday off for July 4th. Tuesday will be a cold open with the markets opening at 8:30 am CDT. Export inspections data will be out on Tuesday morning, with the Crop Progress report released that afternoon. Moving to Thursday, EIA will update their weekly production and stock data for ethanol. Monthly trade data form Census will also be published. Thursday is also the last trade day for July Cotton futures. Due to the holiday, Export Sales will be pushed back to Friday morning.
Visit our Brugler web site at https://www.bruglermarketing.com or call 402-697-3623 for more information on our consulting and advisory services for farm family enterprises and agribusinesses.
There is a risk of loss in futures and options trading. Similar risks exist for cash commodity producers. Past performance is not necessarily indicative of future results.
Copyright 2022 Brugler Marketing & Management, LLC. All rights reserved.