
No relief on rates or inputs as debt stress builds
The July panel for the Ag Economists Monthly Monitor isn't offering much comfort on the cost side of 2027. Nearly seven in 10 expect input prices to stay flat or elevated next crop year, the same share expect ag operating-loan rates to run higher and not one economist forecasts a decline of any size in either. Short-term sentiment is the bright spot: 56% say the ag economy is better off than a month ago, and the Ag Economy Index — a composite of three questions asked every month — climbed to 61 from June's 50. When asked what they are watching most closely, the panel converged on one answer: how well farmers are servicing their debt.
Key Takeaways from the July Panel
Better sentiment, unmoved costs.
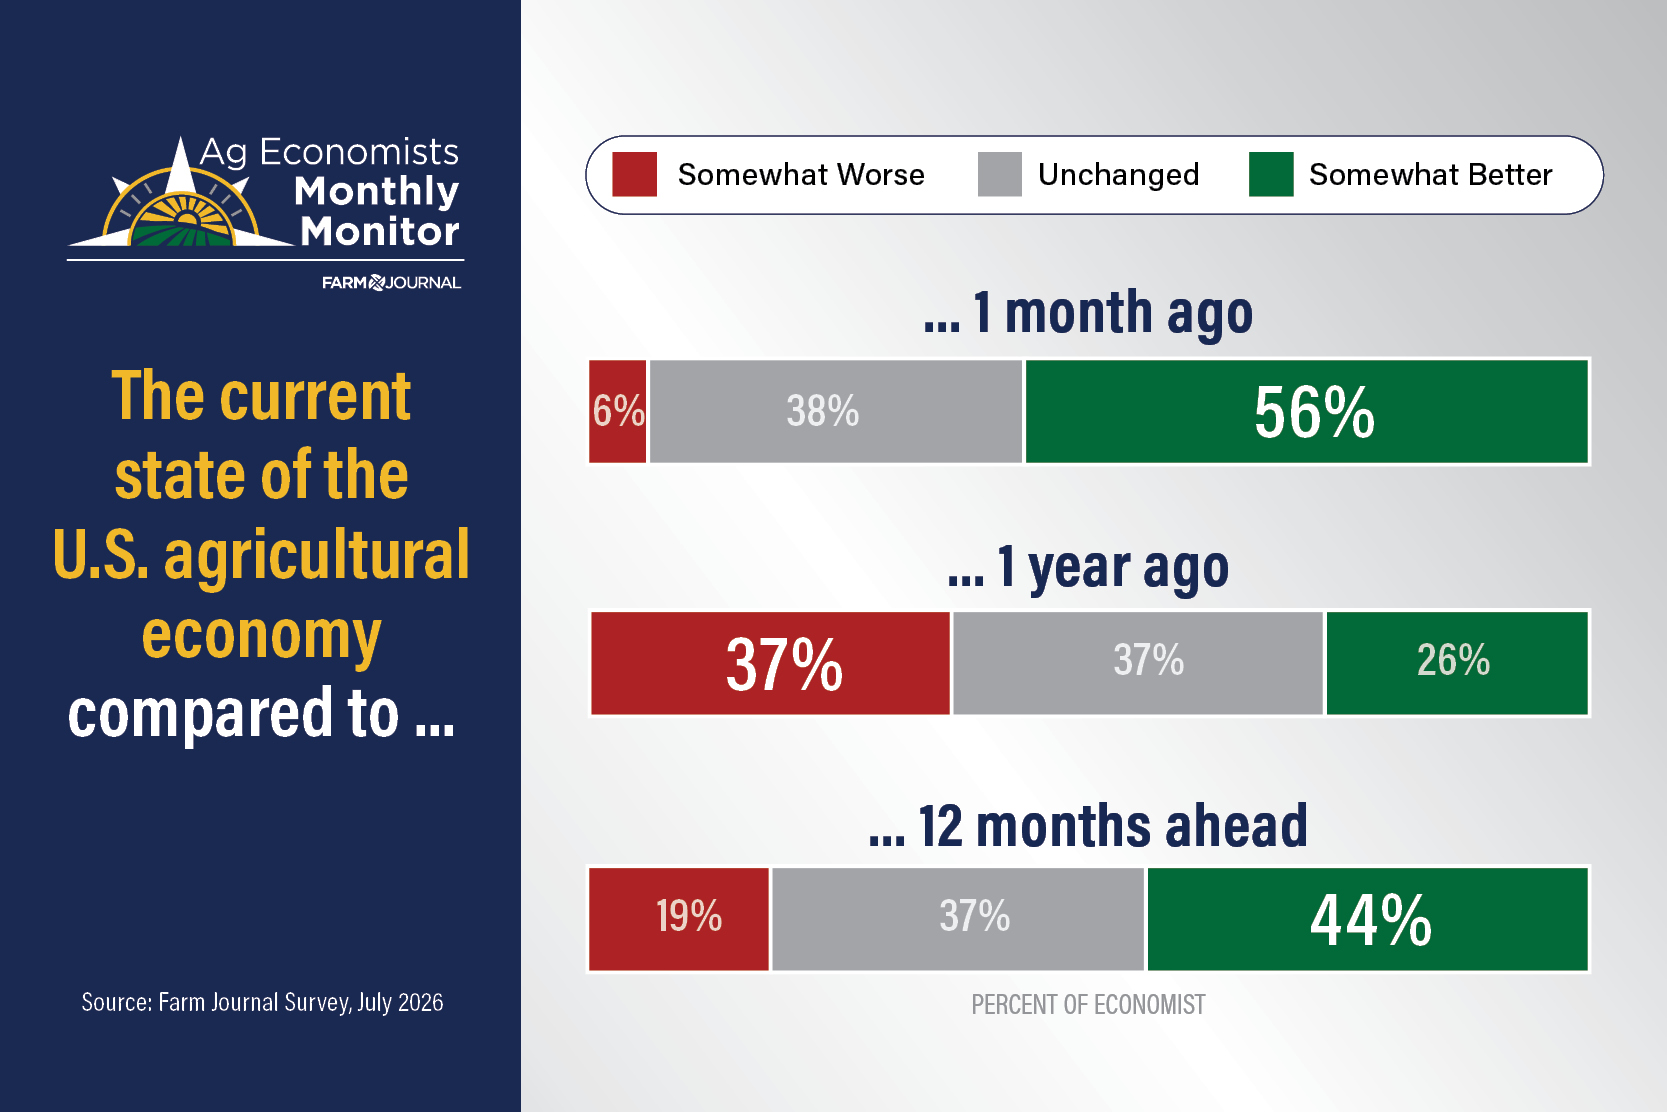
The near-term read jumped: 56% call conditions better than a month ago and 38% call them unchanged — the panel views the month-over-month trend as flat or improving. The longer view is steadier. Against a year ago, 25% see improvement against 38% who see it worse, and 44% expect a better year ahead. No economist chose "much worse off" on any of the three comparisons: The cost and credit pressures are real, but few see the downturn deepening into something more severe.
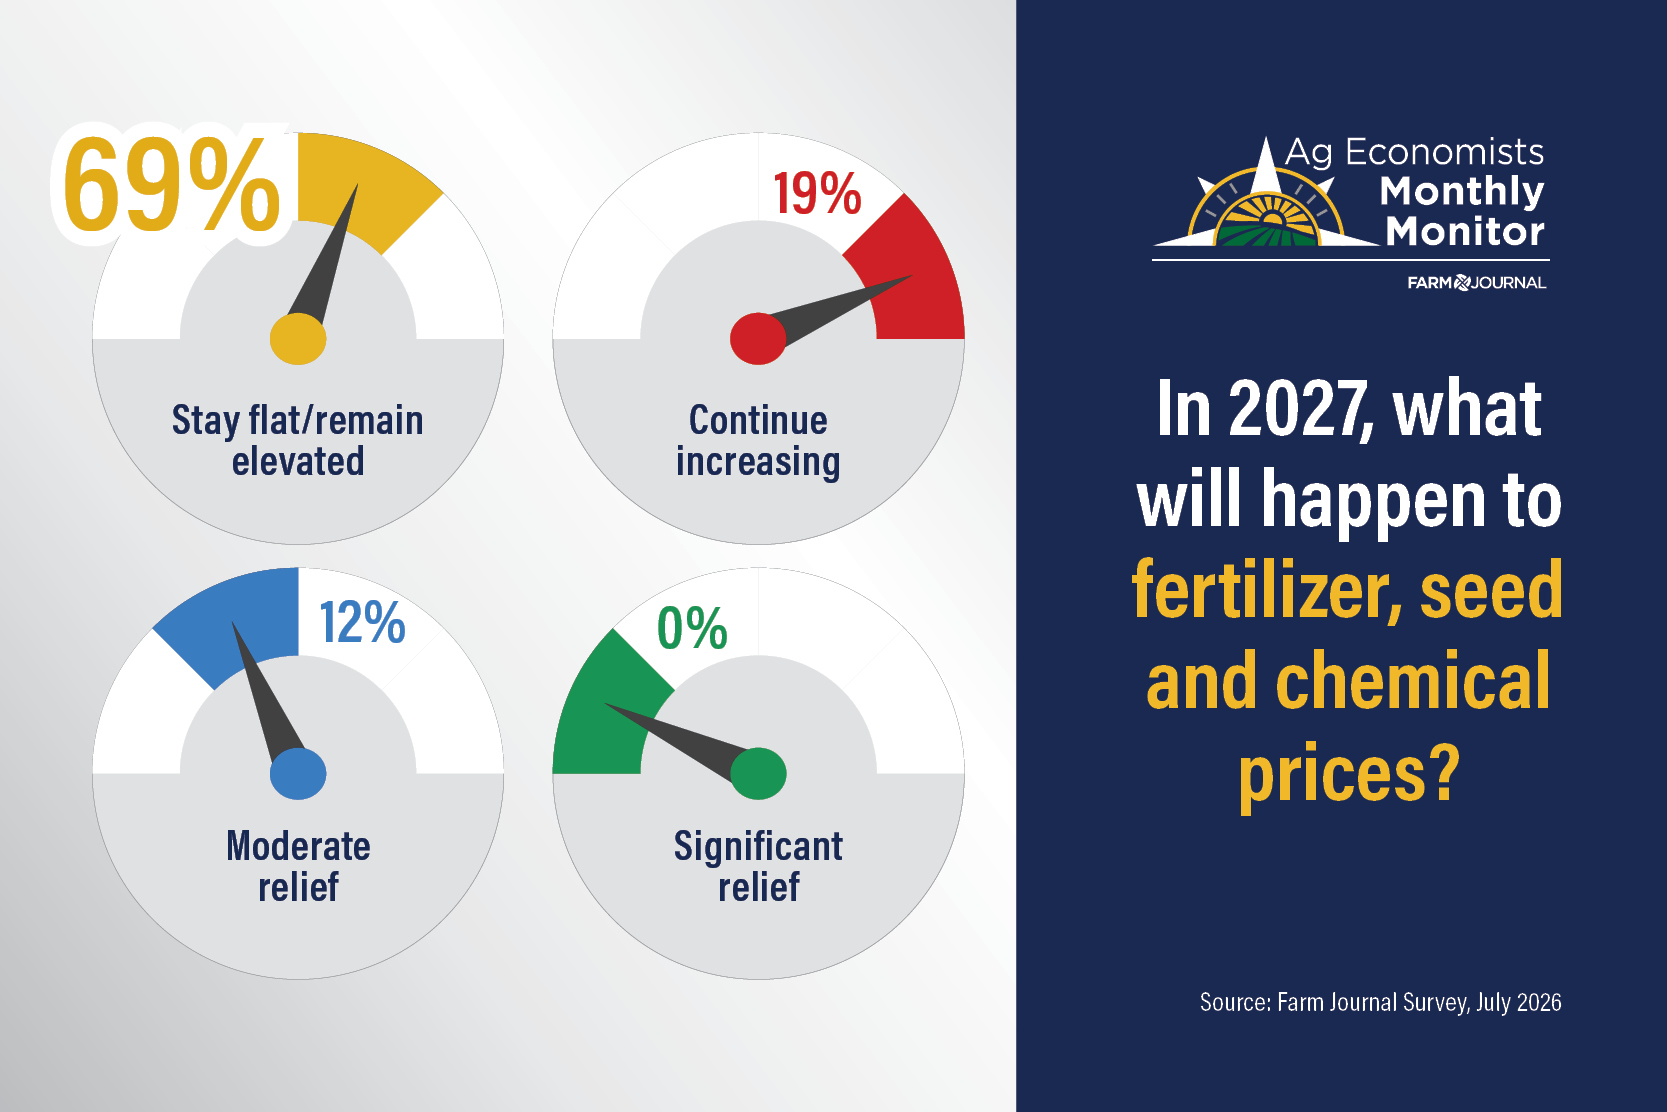
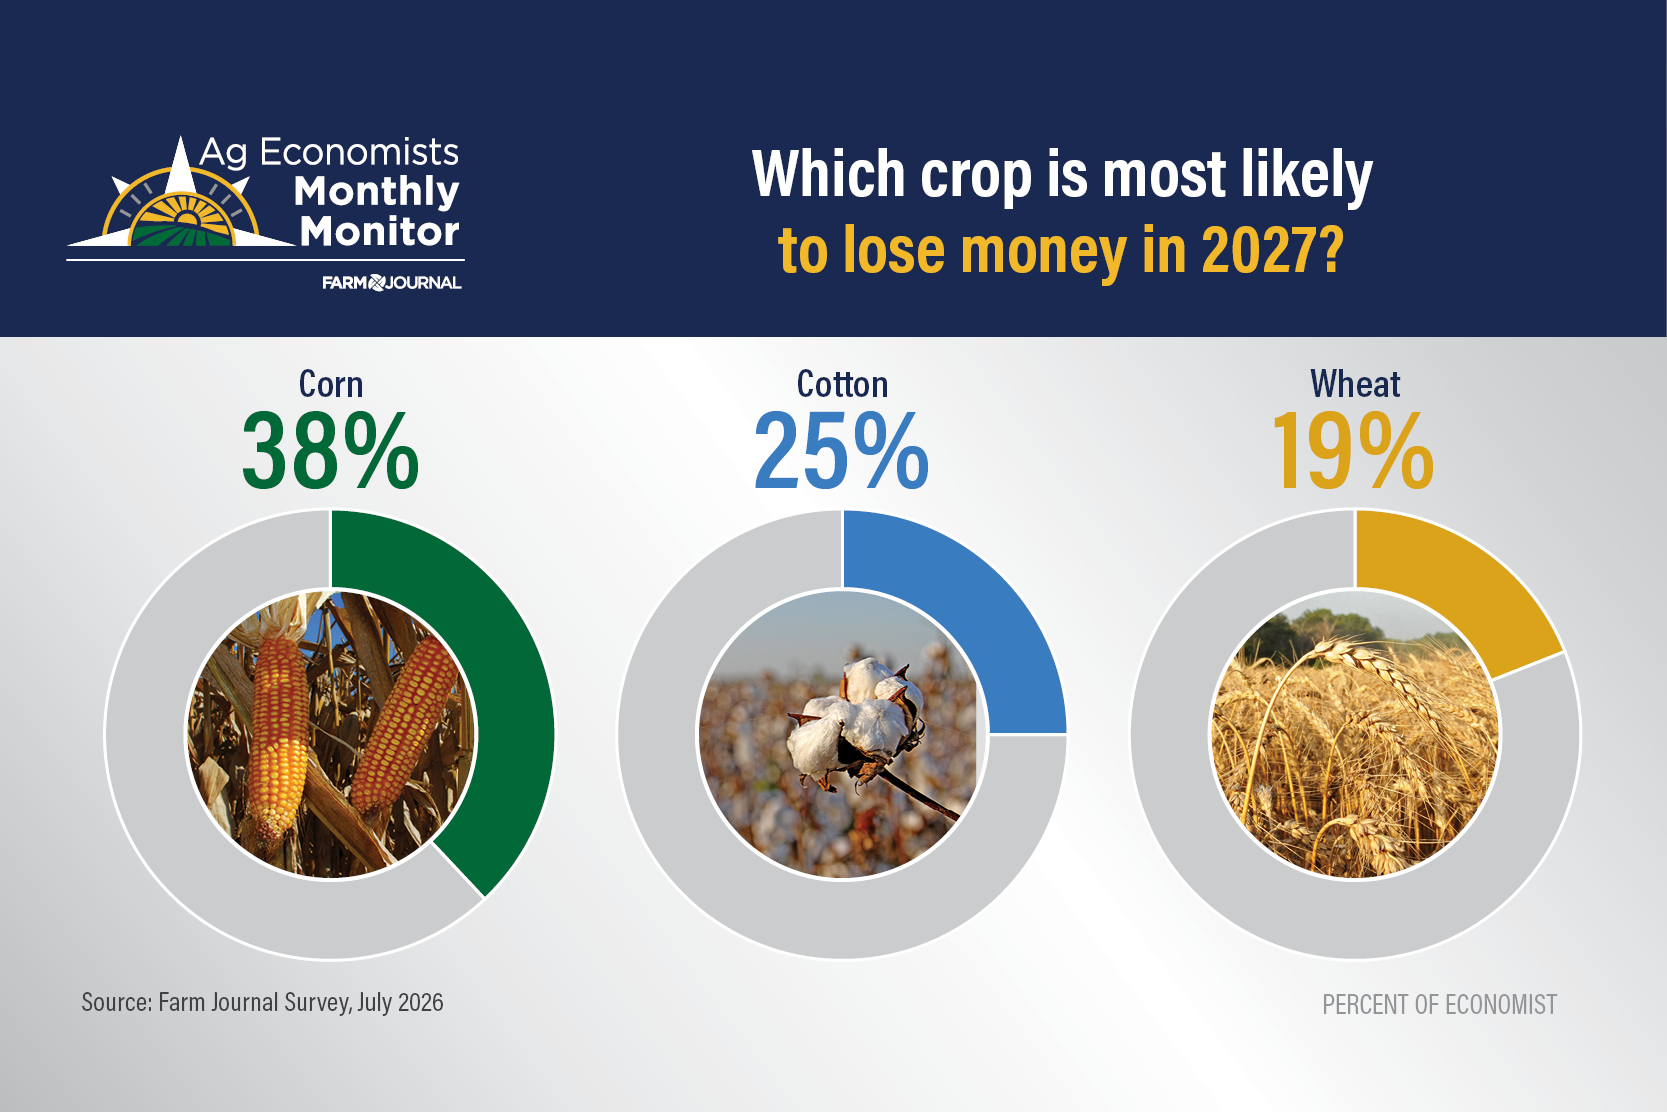
What has not moved is the cost side. Sixty-nine percent expect 2027 input prices to remain flat or elevated, and 19% expect them to keep rising — none see significant relief. The same 69% expect ag operating-loan rates to run slightly higher next season. Corn is the crop most likely to post negative net returns in 2027, named by 38% of the panel.
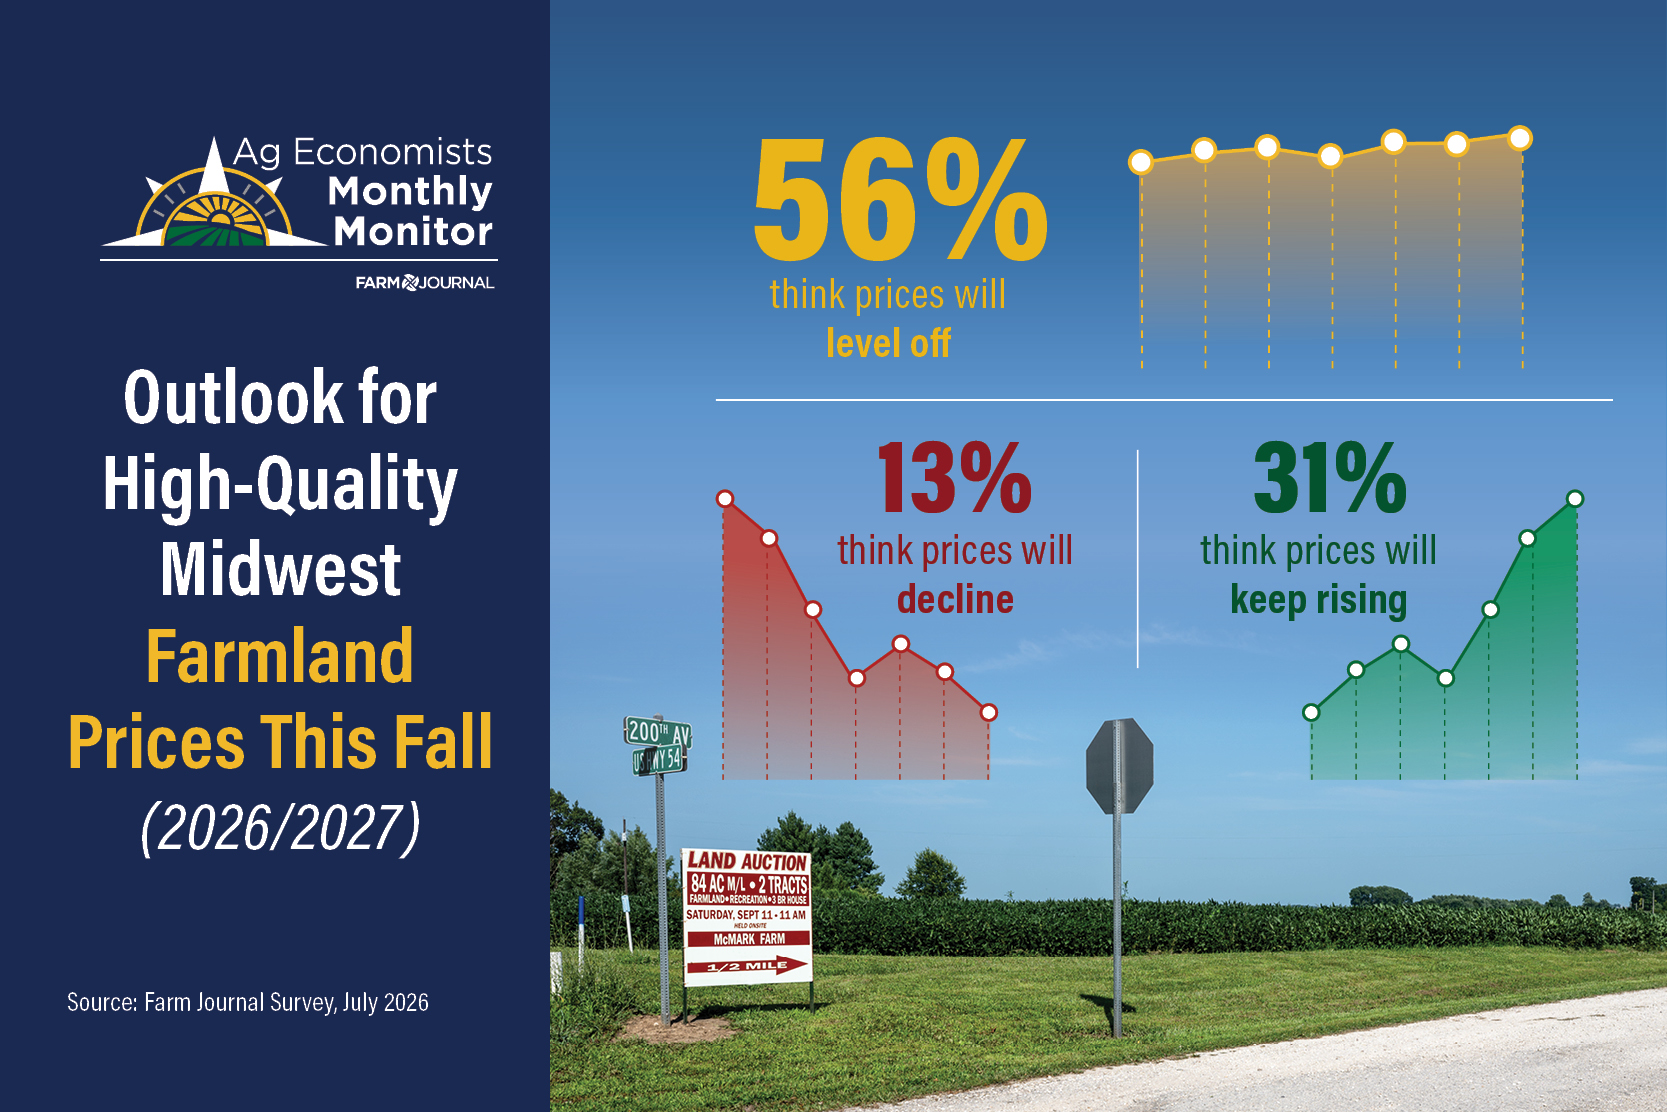
When asked which single indicator they are monitoring most closely, the answers converged on debt: delinquency and default rates on operating loans, repayment behavior on non-traditional credit and the level of farm debt coming out of fall harvest. On land, there is little consensus that a correction is underway — a 56% majority expects values to plateau without declining, and just 13% say a correction is beginning.
Ag Economy Index · monthly composite
The July reading rebounded to 61
Combined Index · July 2026
▲ 11 pts from June's 50
Each bar shows how that tracking question nets out on a 0–100 scale where 50 is neutral — the share of economists calling conditions better minus those calling them worse. The headline reading is the report's monthly composite, weighted 20/20/60 toward the 12-month outlook.
Open-ended panel question
Factors driving agriculture's next 12 months
The input-cost vs. commodity-price squeeze
Weather and yield — a possible El Niño
Geopolitical risk and the war with Iran
Monthly tracking · same questions, every month
The state of the U.S. ag economy
56% call conditions better than a month ago
Still split against a year ago
44% expect a better year ahead
July Assessment · Land costs & 2027 budgets
No consensus that farmland values are turning
Fall lease-termination deadlines are Sept. 1 in some states such as Ohio, Iowa, Nebraska and South Dakota — which means 2027 budgets are being set before the 2026 crop is in the bin. USDA-ERS data puts land at 20% to 40% of row-crop production costs, so the rent line moves the whole budget.
Average U.S. cropland rent ran $160 per acre over the past year — down $1 from the prior year, but still 15% above 2020. The Iowa farmland survey showed the same $1 move. Farm real estate values, meanwhile, rose for a sixth straight year, up 3.4% to $4,500 per acre in 2026 per the American Farm Bureau Federation, with cropland values up 48% since 2020.
Fall 2026/27 Land Auctions
Only 13% see the start of a correction.
Asked whether 2026/2027 fall land auctions will mark the first significant year-over-year decline in high-quality Midwest farmland values since the 2020 rally, a 56% majority expects a plateau without a decline. Another 31% say strong equity positions and cash buyers will sustain current values outright. Just 13% — two economists — say a market correction is beginning.
Borrowing costs move the other way
Rent is only one side of the 2027 budget. More than two-thirds of the panel expect the average interest rate on ag operating loans to run slightly higher next season, and not one expects a significant decline.
July Assessment · 2027 crop year
No input or interest rate relief in sight
The survey's defining finding
Nobody expects significant relief on inputs.
Asked whether U.S. aggregated input prices — fertilizer, seed and chemicals — will adjust in response to current margin compression in the 2027 crop year, 69% say prices stay flat or elevated within 5%. Another 19% expect them to keep increasing. Only 13% see moderate relief, and not one economist expects a drop of more than 10%. That is the arithmetic behind every 2027 budget being written this fall.
Corn carries the highest risk of negative returns
Nearly four in 10 name corn as the crop most likely to post negative net returns in 2027, ahead of cotton and wheat. Not one economist named soybeans — and several said the risk is broad enough that no single crop stands out.
Corn's path to higher prices, says StoneX chief commodities economist Arlan Suderman, is less certain and hinges on pieces still falling into place — how long the war in the Black Sea region persists, and how the fertilizer story develops heading into next year. “Things are aligning in that direction, but they're still not locked in place,” he says.
What it takes to get back to profitable
Asked for the market mechanism required, the panel points overwhelmingly to supply — fewer acres, tighter stocks — with domestic demand the main alternative route.
July Assessment · Ad hoc aid
A lifeline that may also delay the reckoning
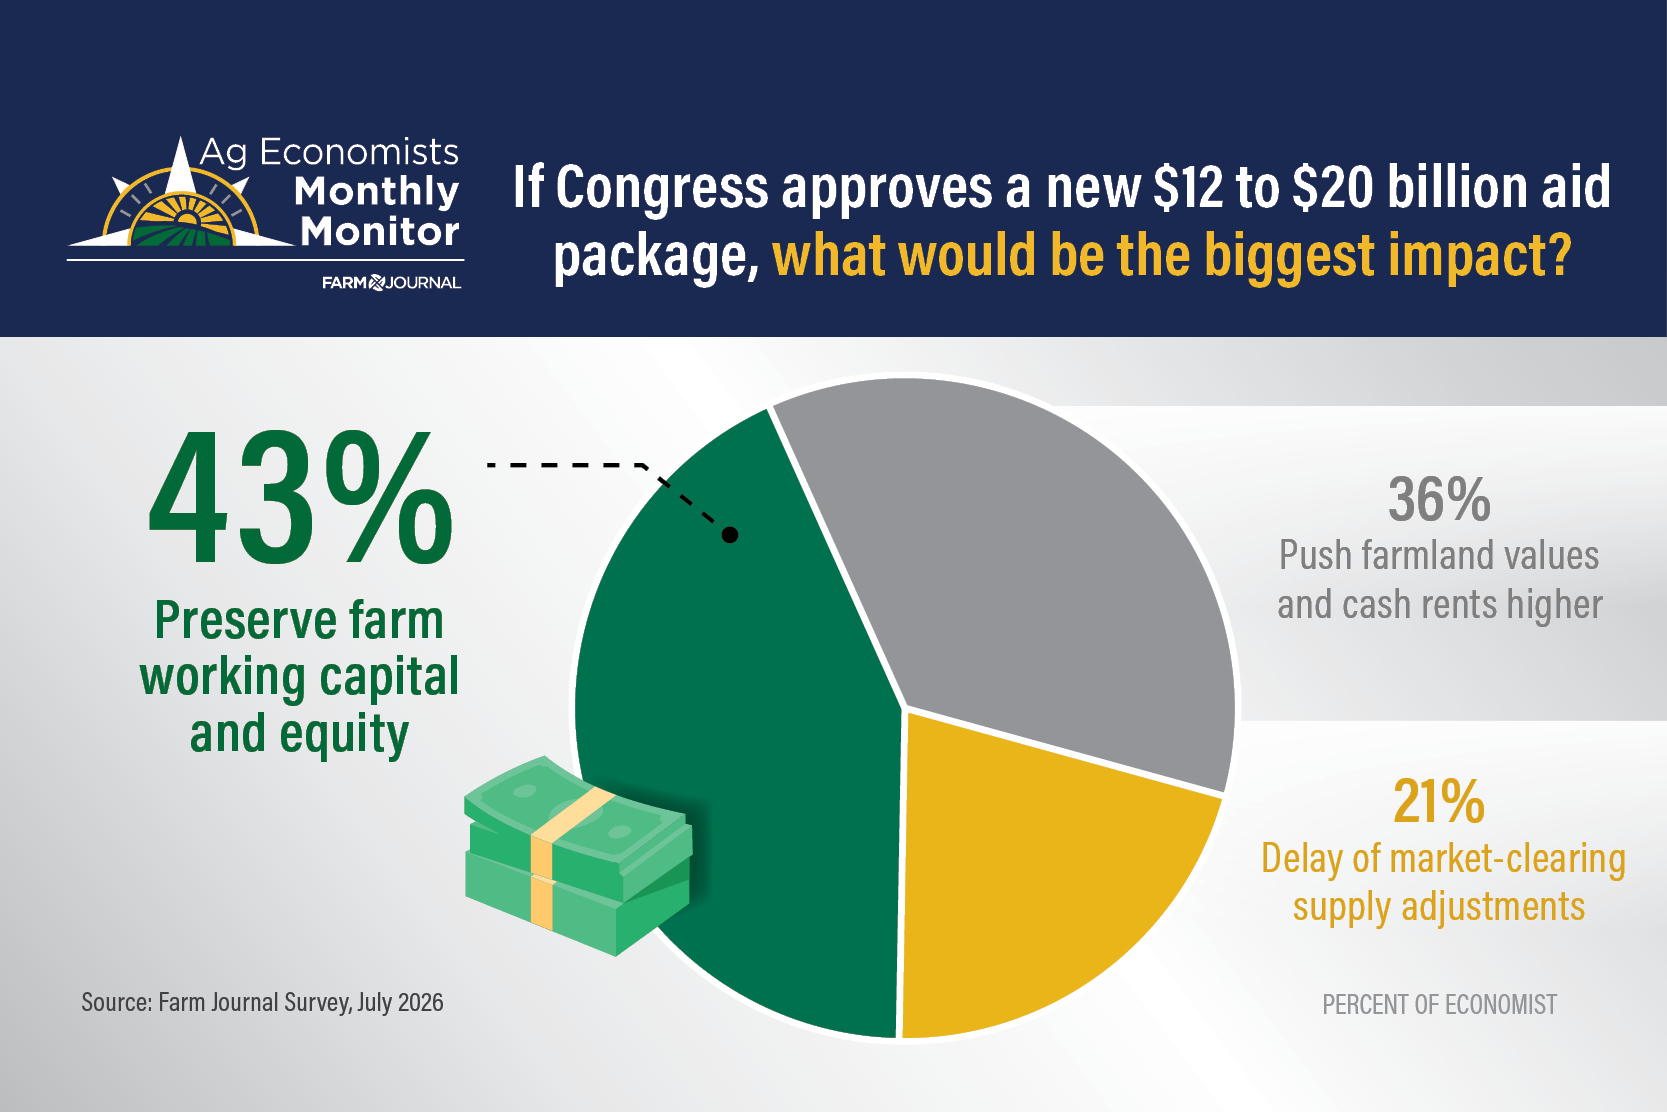
With a $12 billion to $20 billion ad hoc package under discussion in Congress, the panel weighed where the money would actually go — and whether years of ad hoc support are holding U.S. production costs above what the market would set.
Working capital first — land costs second
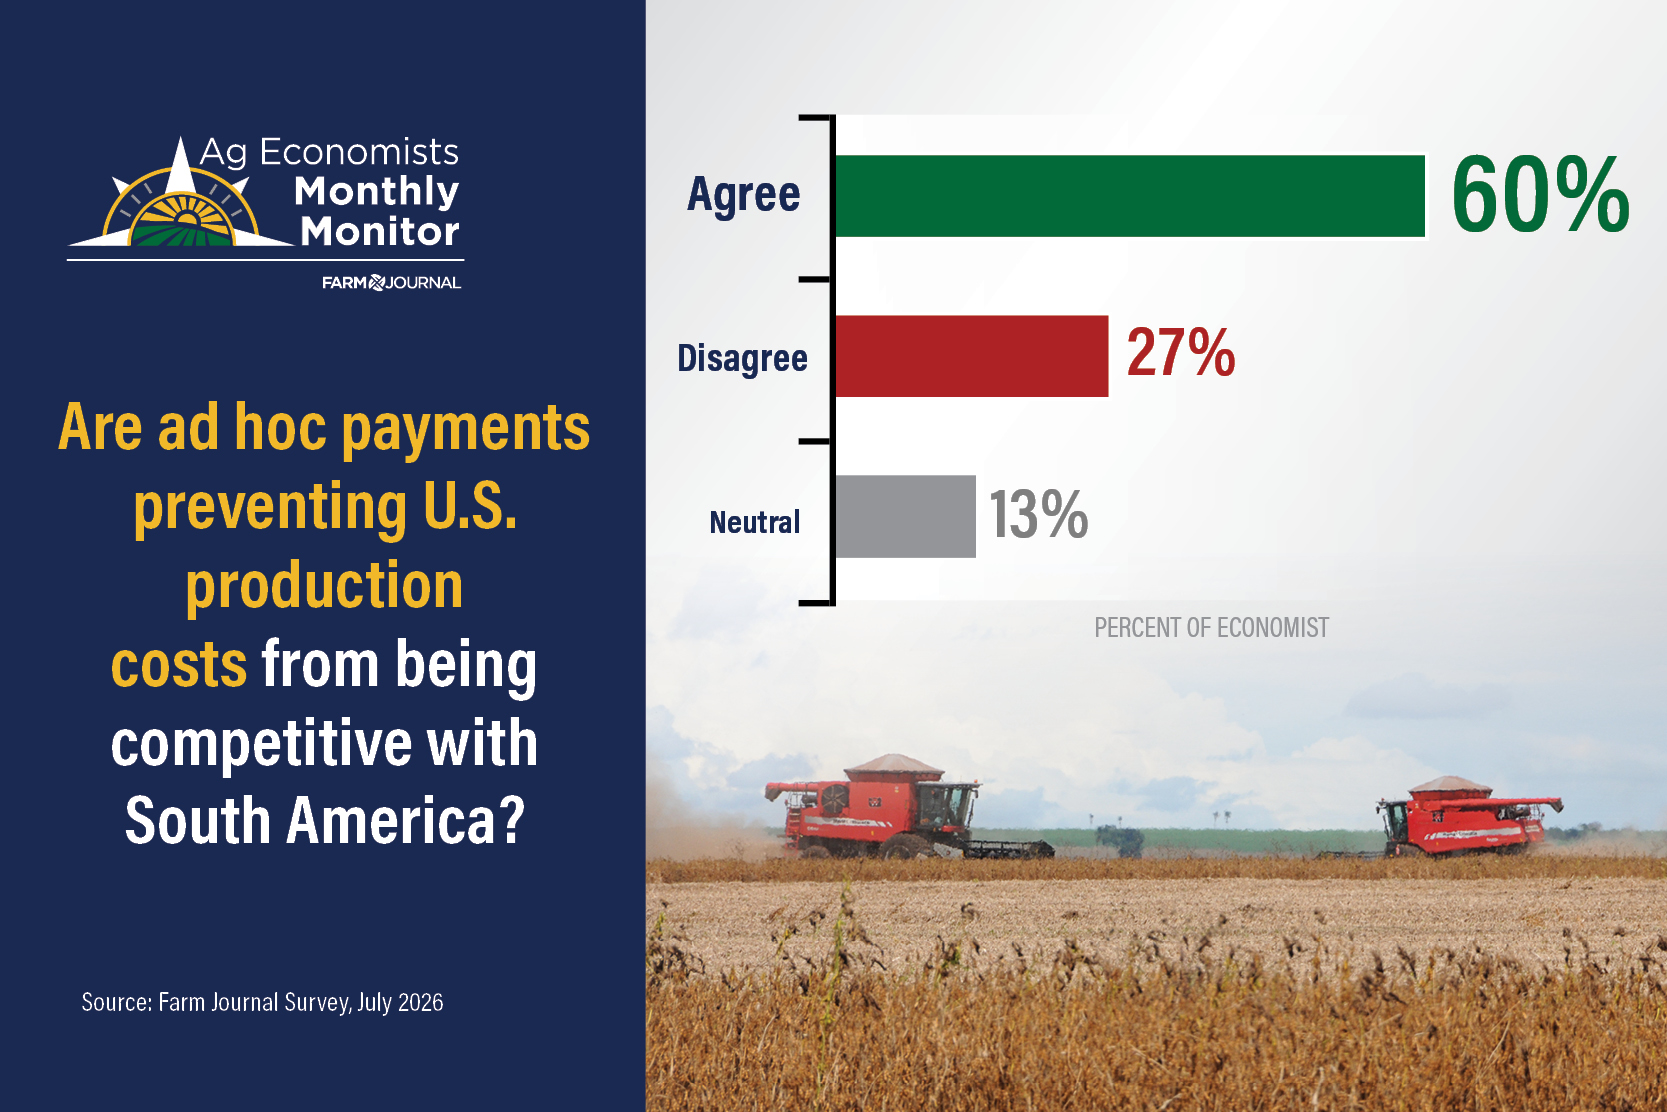
60% agree ad hoc payments keep costs from adjusting
Not one economist expects an aid package to meaningfully strengthen the U.S. competitive position against rivals like Brazil, or to mitigate portfolio credit risk for ag lenders. Sixty percent agree — or strongly agree — that ongoing ad hoc payments are the primary factor keeping U.S. row-crop production costs from adjusting to a level competitive with South America; only 27% disagree.
July Assessment · Cattle & machinery
A plateau in cattle, a slow climb in iron
Half see a plateau — a third still see new highs
Half say two years — none say one
July Assessment · open-ended
Debt stress is the indicator to watch
Credit dominates the answers this month. Where June's panel watched margins and land values, July's converged on one theme: how well farmers are servicing their debt — delinquency and default rates on operating loans, repayment behavior on non-traditional credit lines, and the level of farm debt coming out of fall harvest.
Always a good indicator of farm financial strength.
Typically given to farmers with weaker balance sheets. Would be a strong early indicator.
It's a better measure of financial stress than bankruptcies. It give an idea about lender expectations.
With over 95 million acres in corn, an increase in corn prices would certainly help net farm income.
If business owners start offloading assets - it'll start first with the "extra" farm machinery.
Many economic indicators are lagging, especially from a national data perspective. Input costs like fertilizer and fuel can be tracked in real time and used to estimate impact on indicators like net farm income.
The ability to service loans is one of the primary indicators of how the Ag economy is actually doing.
If the adequacy of coverage of farmer's cash flow needs were to decline, then their farm financial credit needs will increase. The key indicator of farmer's financial conditions will likely be their borrowing needs - whether they are increasing or not.
An ag lender's view: stress is building, but it isn't wholesale
Farm Journal took the panel's finding to a lender. Alan Hoskins, president and national sales director at American Farm Mortgage & Financial Services, says his own loan book is showing early signs of the same trend.
Report assets · free to use with attribution
Download the charts
About the Ag Economist Monthly Monitor
The Ag Economists Monthly Monitor is administered by Farm Journal and published on AgWeb. Each survey is administered to a vetted list of agricultural economists from across the United States.
Three of those questions repeat every survey, so changes can be tracked over time: current conditions vs. the prior month, current conditions vs. a year ago and the panel's outlook for the next twelve months. The trend chart plots those three categories. The composite sentiment index is a rebase of the four response shares to a single 0–100 number.
Responses are anonymous. Economists give the unvarnished view they cannot always offer with their name attached, and the panel composition is broad enough to cover crop, livestock, policy and ag finance perspectives. Reporting and analysis are produced by the AgWeb editorial team and overviews are aired on AgDay, AgriTalk and U.S. Farm Report.
Ask our editors a question
Have a question about the report findings? Send it straight to our editorial team. Are you an agricultural economist? Tell us if you’d like to be considered for future survey panels.