Corn Planting Progress the Slowest Since 2013
As of May 1, USDA estimates 14% of the U.S. corn crop has been planted. That compares to a five-year average of 33% planted. Last year, 42% was planted by May 1.
This year’s planting pace is the slowest since 2013.
Roll over the grey buttons below to get a closer look at each state.
Which states are the furthest behind?
| State | Percent Complete | 5-Year Average | Percentage Points Behind 5-Year Average |
| Illinois | 7 | 43 | 36 |
| Iowa | 9 | 42 | 33 |
| Minnesota | 0 | 28 | 28 |
| Missouri | 27 | 52 | 25 |
| Indiana | 6 | 25 | 19 |
| Kentucky | 26 | 42 | 16 |
| Tennessee | 42 | 55 | 13 |
| Ohio | 3 | 16 | 13 |
| Wisconsin | 1 | 14 | 13 |
| South Dakota | 3 | 13 | 10 |
| Michigan | 1 | 10 | 9 |
| Nebraska | 28 | 34 | 6 |
| Colorado | 13 | 19 | 6 |
| North Dakota | 0 | 5 | 5 |
*As of May 1, 2022
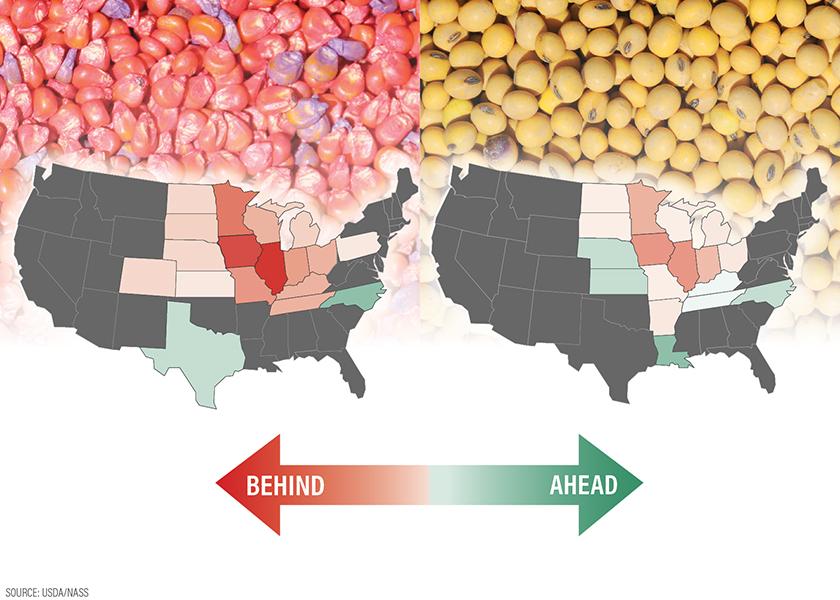
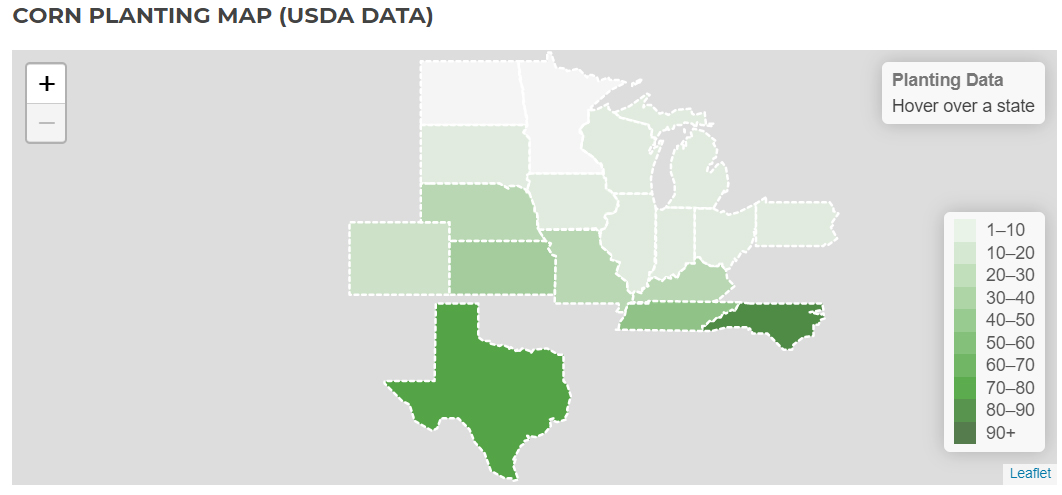
Meanwhile, North Carolina and Texas are ahead of the five-year average for corn planting.
See AgWeb's Corn Planting Map:
U.S. farmers had planted just 14% of their #corn crop by May 1, the slowest for the date since 2013 and well behind the average of 33%. That is up from 7% in the prior week. Trade expected 16%. pic.twitter.com/1C4z6SWMRy — Karen Braun (@kannbwx) May 2, 2022
As of May 1, USDA estimates 8% of the U.S. soybean crop has been planted. That compares to a five-year average of 13% planted. Last year 22% was planted by May 1.
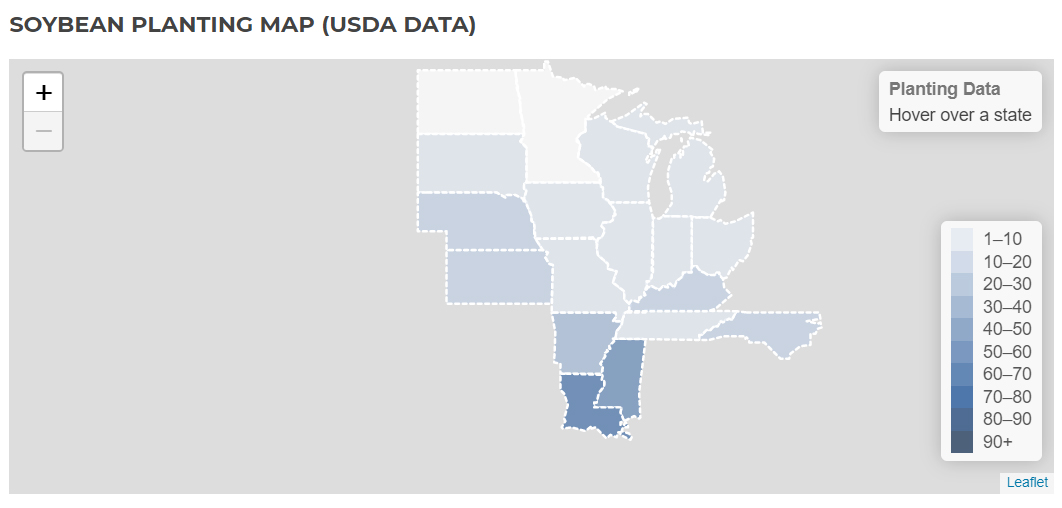
Illinois, Iowa and Indiana are the furthest behind in soybean planting compared to the five-year averages for each state.
Roll over the grey buttons below to get a closer look at each state.
See AgWeb's Soybean Planting Map:
Cotton planting is on pace with 16% of the crop in the ground, which is on pace with last year and the five-year average.
See the full Crop Progress report.