USDA Day with Oliver Sloup

Grain Prices Rally Ahead of USDA Report
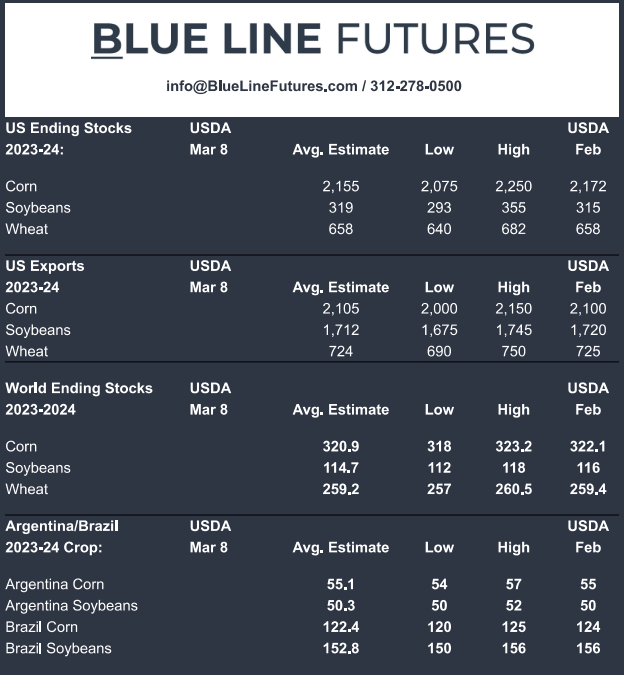
Estimates for today's USDA Report
Corn
Technicals (May)
May corn futures broke out above our pivot pocket from 429 1/2-433 1/4 which accelerated the buying, taking prices as much as 30 cents off the low from February 26th. As mentioned in our yesterday's interview with Chip Flory and AgriTalk, the 20-day moving average seems like such a simple indicator but the fact that everyone was watching it almost made it self-fulfilling. The next upside hurdle comes in from 440-441 with more significant resistance coming in from 447 1/2-450. On the flip side, previous resistance will now act as support (429 1/2-433 1/4).
Bias: Bullish
Resistance: 440-441, 447 1/2-450*
Pivot: 429 1/2-433 1/4
Support: 421-422, 415-416, 398-402**

Fundamental Notes
- Weekly export sales recap: Net sales of 1,109,600 MT (43,683,010 bushels) for 2023/2024 were up 3 percent from the previous week, but unchanged from the prior 4-week average. This was within the range of expectations and similar to the number we saw in last week's report.
- The United States has been losing corn export business to Brazil as the South American country continues expanding its output, though top customer Mexico has secured a record volume of U.S. corn for shipment this year. Mexico’s large chunk of U.S. sales is aided by the fact that China accounts for just 6% of all U.S. corn sales so far, down from about 17% a year ago and about 28% two years ago. Japan’s 14% is above the recent average but below the pre-2021 levels, before China became a big U.S. corn buyer. -Reuters
- The future of U.S.-Mexico corn trade is uncertain as Mexico in recent years has proposed to ban or limit GM corn imports. GM corn accounts for the vast majority of U.S. production, though the lack of alternative options for Mexico has kept market participants’ concerns at bay. -Reuters
Seasonal Tendencies
We put together a more in-depth seasonal analysis article yesterday, zooming in on historical price action leading up to the quarterly stocks and prospective plantings report. Check it out here:
Weekly Seasonal Analysis Update – Blue Line Ag Hedge
Fund Positioning
We took a deeper dive into current Fund positioning and price action and how it compares with 2019. Check it out here:
Are Funds Overextended? – Blue Line Ag Hedge
Soybeans
Technicals (May)
Soybean futures are poking their head out above trendline resistance which started forming at the end of last year. Like seemingly every other market out there, prices are now knocking on the door of the 20-day moving average, something that we've not seen the market close above since the first half of December. It seems oversimplified, but if enough people are focusing on one indicator it could have self-fulfilling affects. If the Bulls can chew through and close above it, it could spur a move back towards the technically and psychologically significant $12.00 level. Today's USDA report could have implications on whether we breakout or not. A failure to breakout likely keeps prices in a consolidation pattern.
Bias: Neutral/Bullish
Resistance: 1184, 1198-1205 1/2*
Pivot: 1163-1168
Support: 1125-1130**

Fundamental Notes
Weekly Export Sales: Net sales of 613,500 MT (22,542,259 bushels) for 2023/2024 were up noticeably from the previous week and from the prior 4-week average. This was above the top end of expectations.
China imported 13.04 million metric tons of soybeans for the first two months of the year, the lowest for the period in five years, customs data showed on Thursday. The imports are the lowest for the period since 2019. -Reuters
Seasonal Tendencies
Seasonal tendencies have been out the window to start the year, so I'm not sure how much weight one puts into them at this juncture, but seasonally we tend to see some consolidation and strength from the middle of March to the middle of April.
*Past performance is not necessarily indicative of futures results.
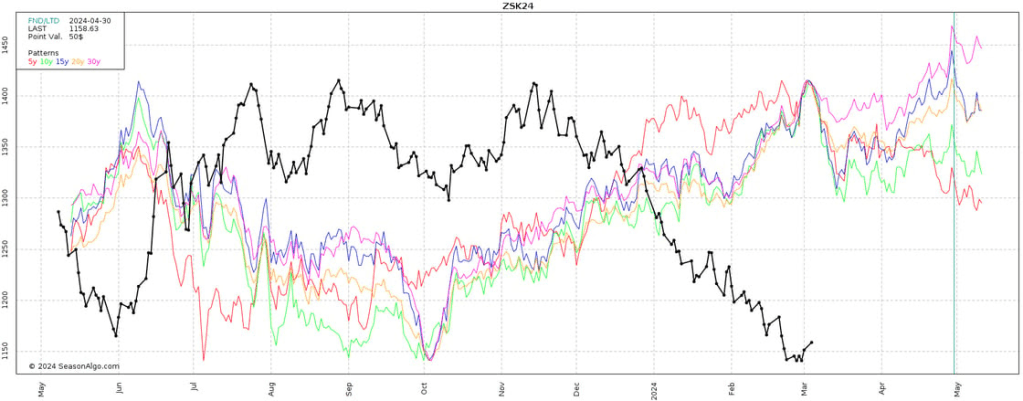
MRCI shows back tested results for a bullish seasonal that starts on March 17th and goes through April 21st. They show this as bullish for 13 of the last 15 years with the average rally being about 56 cents and the average loss being about 37 cents. See the table below.
*Past performance is not necessarily indicative of futures results.

Check out the full Report at USDA Day! - Blue Line Futures
Futures trading involves substantial risk of loss and may not be suitable for all investors. Therefore, carefully consider whether such trading is suitable for you in light of your financial condition. Trading advice is based on information taken from trade and statistical services and other sources Blue Line Futures, LLC believes are reliable. We do not guarantee that such information is accurate or complete and it should not be relied upon as such. Trading advice reflects our good faith judgment at a specific time and is subject to change without notice. There is no guarantee that the advice we give will result in profitable trades. All trading decisions will be made by the account holder. Past performance is not necessarily indicative of future results.
Blue Line Futures is a member of NFA and is subject to NFA’s regulatory oversight and examinations. However, you should be aware that the NFA does not have regulatory oversight authority over underlying or spot virtual currency products or transactions or virtual currency exchanges, custodians or markets. Therefore, carefully consider whether such trading is suitable for you considering your financial condition.
With Cyber-attacks on the rise, attacking firms in the healthcare, financial, energy and other state and global sectors, Blue Line Futures wants you to be safe! Blue Line Futures will never contact you via a third party application. Blue Line Futures employees use only firm authorized email addresses and phone numbers. If you are contacted by any person and want to confirm identity please reach out to us at info@bluelinefutures.com or call us at 312- 278-0500
Performance Disclaimer
Hypothetical performance results have many inherent limitations, some of which are described below. No representation is being made that any account will or is likely to achieve profits or losses similar to those shown. In fact, there are frequently sharp differences between hypothetical performance results and the actual results subsequently achieved by any particular trading program.
One of the limitations of hypothetical performance results is that they are generally prepared with the benefit of hindsight. In addition, hypothetical trading does not involve financial risk, and no hypothetical trading record can completely account for the impact of financial risk in actual trading. For example, the ability to withstand losses or to adhere to a particular trading program in spite of trading losses are material points which can also adversely affect actual trading results. There are numerous other factors related to the markets in general or to the implementation of any specific trading program which cannot be fully accounted for in the preparation of hypothetical performance results and all of which can adversely affect actual trading results.