3 Reasons Why Corn Prices Surged to a Two-Month High
December corn futures rose to the highest price since late June and soybeans and wheat also rose amid concern over dry weather.
Why did corn prices surge? Several bullish factors are at play, says Joe Vaclavik, president of Standard Grain. Those include:
1. Lower crop condition ratings.
As of Aug. 21, USDA estimates 55% of the U.S. corn crop is in good-to-excellent condition. That’s down two percentage points from last week and five percentage points from this time last year. “That’s the lowest rating in at least five years,” Vaclavik says.
2. Severe drought across the globe.
Severe droughts across the Northern Hemisphere — stretching from the farms of California to waterways in Europe and China — are further snarling supply chains and driving up the prices of food and energy, adding pressure to a global trade system already under stress, the Wall Street Journal reports. Parts of China are experiencing their longest sustained heat wave since record-keeping began in 1961, leading to manufacturing shutdowns owing to lack of hydropower.
The drought affecting Spain, Portugal, France and Italy is on track to be the worst in 500 years.
In the American West, a drought that began two decades ago now appears to be the worst in 1,200 years. For some of the world’s biggest economies, this summer’s droughts are hurting industries including electricity generation, agriculture, manufacturing and tourism. That is compounding existing strains such as supply-chain disruptions stemming from the Covid-19 pandemic and pressure on energy and food prices from the war in Ukraine, the WSJ article concludes.
3. Disappointing Crop Tour findings
Here’s a rundown of the 2022 Pro Farmer Crop Tour data:
South Dakota: Samples found an average corn yield of 118.45 bu. per acre in South Dakota, down sharply from both last year’s 151.45 bu. per acre estimate and the three-year Crop Tour average of 161.59 bu. per acre. Soybean pod counts in a 3’x3’ square came in at 871.40 for South Dakota, down from 996.86 in 2021 and 1,026.86 for the three-year average.
Ohio: Samples yielded an average corn yield of 174.17 bu. per acre, down from 185.06 bu. per acre in 2021 but up from the three-year average of 169.03 bu. per acre. Soybean pod counts in a 3’x3’ square totaled 1,131.64 for Ohio, down from 1,195.37 in 2021 and below the three-year average of 1,038.35.
Nebraska: Samples showed an average corn yield of 158.53 bu. per acre in Nebraska, down from both last year’s 182.35 bu. per acre estimate and the three-year Tour average of 176.68 bu. per acre. Soybean pod counts in a 3’x3’ square came in at 1,063.72 for Nebraska, down from both 1,226.43 in 2021 and the three-year Tour average of 1,245.06.
Indiana: Samples yielded an average corn yield of 177.85 bu. per acre, down from both 193.48 bu. per acre in 2021 and the three-year Tour average of 178.26 bu. per acre. Soybean pod counts in a 3’x3’ square totaled 1,165.97 for Indiana, down from 1,239.72 in 2021 but above the three-year average of 1,148,26.
“This morning we’re leaving Nebraska City, Neb., and we’ll tour the western half of Iowa, west of I-35; we end up in Spencer, Iowa,” says Brent Judisch, western leg scout and Iowa farmer. “The western tier of Iowa has been pretty dry this year. We’ve seen some really dry areas of Nebraska. It will be a discovery process to see just how far that dry area carried into Iowa.”
#pftour22 Harrison County Iowa . Corn sample 165 BPA. pic.twitter.com/XqYe7hIqJP — brentjudisch (@brent8320r) August 24, 2022
The samples take on day three could improve overall crop estimates, Vaclavik says.
“A lot of the estimates so far have been disappointing, but the best stuff they’ll see will probably come from those states, Iowa and Illinois in particular,” he says. “The Tour is having an impact on the markets.”
The Next Wave of Crop Tour Data
On Day 3, Crop Tour scouts on the western leg will sample fields in western Iowa and southern Minnesota, and scouts on the eastern leg will sample Illinois and eastern Iowa.
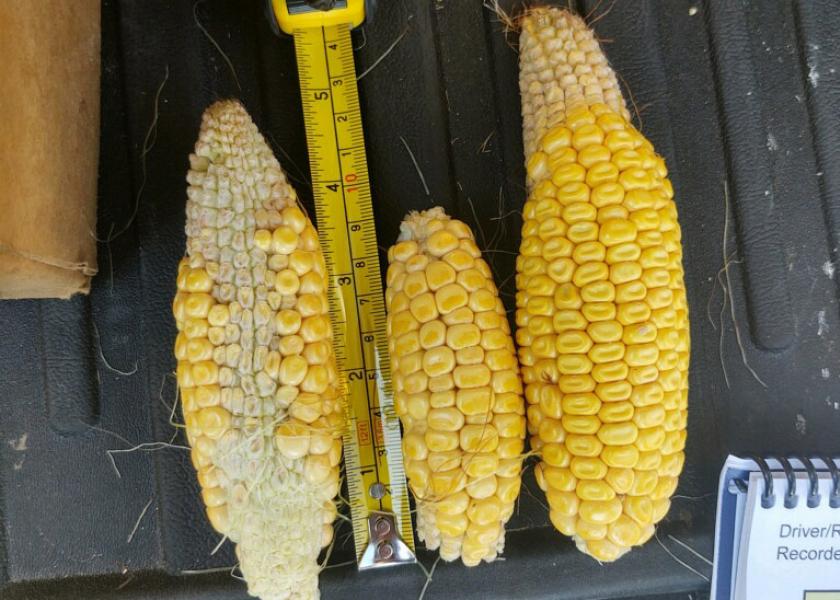
Potta… co IA stop 2. Much lower ear count, but slightly better grain length. 178 #pftour22 pic.twitter.com/bb0dMYOBTU — Ted Seifried (@TheTedSpread) August 24, 2022
Tonight, tour data will include the official numbers for Illinois and the western tier of counties for Iowa (crop districts 1, 4 and 7).
Register to attend a nightly meeting or you can tune in each night at 8 p.m. CDT for a 15-min. overview of results and crop reports.
Read more coverage of the 2022 Pro Farmer Crop Tour.
Check the latest market prices in AgWeb's Commodity Markets Center.